( 1 ) To shorten the test time and investigate durability, low catalyst loading and high voltage are crucial for accelerated durability ( AST ) testing. During stable operation, voltage loss is low, but cyclic pulse testing (AST) accelerates performance degradation. Iridium dissolution leads to performance degradation, thinning the anode catalyst layer, and increasing kinetic losses during long-term operation. Catalyst morphology changes were observed in the catalyst layer, and impedance testing suggested that catalyst / ionomer / membrane interface degradation may also play a role.
( 2 ) The impact of simulated renewable energy fluctuations on electrolyzer performance loss is smaller than that of triangular and square wave cycles because the fluctuation frequency of renewable energy is relatively low. Under both test conditions, dynamic losses play a dominant role, indicating that high-frequency fluctuations accelerate performance loss. Therefore, it can be used to predict the impact of fluctuating operation on the life of PEM electrolyzer equipment.
( 3 ) The research results show that the decline in electrolysis performance will reduce the durability of the electrolyzer at low catalyst loading and intermittent operation. In the future, it is necessary to reduce the attenuation of PEM hydrogen production performance and improve durability through a combination of component development and system control .
introduction
At present, hydrogen production from water electrolysis accounts for a relatively small proportion of energy consumption. Hydrogen supply is mainly produced through steam methane reforming. When hydrogen production from water electrolysis is directly coupled with low-cost renewable energy, it is expected to help reduce the cost of hydrogen production. At present, the cost of electrolysis is related to the price of electricity. When the price of electricity is reduced and a large amount of renewable energy is supplied intermittently, the capital cost will dominate. At the same time, the loading of platinum group metals needs to meet the future target of 0.1mg/cm2 . At present, commercial electrolyzers have a long life when in operation (mainly steady-state operation), but whether they can meet the hydrogen production cost targets in different application scenarios, and whether high-loaded catalysts will mask component degradation and other issues. To meet the future demand for low precious metal loading and volatility, it is necessary to conduct in-depth research on how these factors affect the life of PEM electrolyzers and the cost of hydrogen production.
In PEM electrolyzers, iridium-based catalysts are commonly used for the anode OER reaction. Researchers have proposed a standardized protocol for testing the performance and durability of membrane electrode assemblies ( MEAs ) (instead of RDE testing). Several studies have utilized MEA durability to evaluate the performance of novel catalysts and other components. These studies focus on the impact of low catalyst loading and intermittent operation on durability, including the effects on electrolysis performance, iridium dissolution, and catalyst layer structure.
This study investigates the durability of PEM electrolyzer MEAs , focusing on anode catalyst degradation under low precious metal loading and intermittent operating conditions. This study examines the impact of long-term durability when PEM water electrolysis is coupled with intermittent renewable energy to reduce the cost of hydrogen production. This study provides quantitative metrics for membrane electrode development regarding the degradation mechanisms of PEM electrolysis performance, including evaluating durability test voltages and the degree of performance improvement required to overcome high potential and performance losses. Durability data can be used in cost analysis to assess the ability of electrolyzers to operate under low precious metal loading and fluctuating operating conditions, and component development and system control are also required to reduce potential and performance losses.
Experimental part
MEA preparation: active area is 25cm2 , N117 membrane , cathode catalyst: Pt/C ( TKK ), cathode Pt loading is 0.1mg/cm2 , anode catalyst is iridium oxide, iridium loading is 0.1-0.4mg/cm2 , evaluate the impact of loading on durability.
MEA test: polarization curve test at normal pressure, 80°C , and anode water flow rate of 0.3L/min . CV curve measurement range is 0.025-1.3V ;
Durability is tested using a constant voltage, which determines the catalyst dissolution rate and can provide a reference for catalyst durability under different operating parameters and material combinations.
in the MEA durability assessment, including anode catalyst loading, pulse type (hold, triangle wave, square wave), degree of fluctuation (peak potential), duration ( 0-31.5k cycles), cycling frequency, potential ramp (sawtooth, gentle square wave), and renewable energy input. Triangle and square wave pulses were tested at various catalyst loadings ( 0.1 , 0.2 , and 0.4 mg/cm² ) and higher potentials ( 1.6 , 1.8 , 2 , 2.2 , and 2.5 V ) for 525 hours ( 31.5k cycles). Polarization curves and electrochemical measurements ( CV curves, impedance) were recorded every 75 hours . Fluctuation curves were used to assess potential spikes and dips (Figures S.1d and S.1e ). The sawtooth-shaped rising curve consisted of a sudden rise from 1.45 to 2 V and a gradual fall to 1.45 V ; the sawtooth-shaped falling curve consisted of a gradual rise from 1.45 to 2 V and a sudden fall to 1.45 V. Cycle frequencies of 10 , 30 , 60 , and 120 seconds were studied . Ramp times from 1.45 to 2 V (or its reverse direction) were 5 , 10 , and 15 seconds to evaluate the effectiveness of system control measures in reducing losses and addressing the durability differences between triangular and square wave tests. The wind and solar power fluctuation renewable input models were derived from field data, representing average daily values. The power input was converted to voltage for comparison with the triangular and square wave tests, and the model was set to maintain the maximum ( 2.25 V ), minimum ( 1.45 V ), and average ( 1.70 V ) potentials constant. The inputs (wind speed and solar power) were converted to electrolytic potentials, and the potentials were summed every 3 minutes to form a 24-hour test curve, which was then replicated. During the 90 -day experiment, polarization curves and electrochemical data ( CV curves, impedance spectra) were collected every 3 days.
Electrochemical testing and polarization curve analysis were used to investigate the causes of MEA performance degradation. Ohmic losses were determined by the difference between the high-frequency resistance ( HFR ) and the polarization curve . Mass transfer losses were determined by the difference between the polarization curve and the Tafel slope. Anodic and cathodic kinetic exchange currents were estimated from the OER (iridium oxide, 1.7×10⁻⁶ A /mg Ir ) and HER ( Pt/C , 0.55 A/mg Pt ) measured in a RDE half-cell . Iridium oxide dissolution rates at different potentials ( 1.4 , 1.45 , 1.5 , 1.55 , 1.6 , 1.7 , 1.8 , 1.9 , and 2 V ) were calculated based on ICP-MS data from the RDE study . The experiment was conducted by holding the potential for 5 days, with the working electrode tested at 2500 rpm in 0.1 M HClO₄ . Samples were taken periodically ( 5 min , 30 min , 1 h , 4 h , 13.5 h , 24 h , 48 h , and 120 h ) for ICP-MS measurement. The dissolution rate ( ng/s ) at each potential was calculated from the slope of the total dissolved iridium content versus the experimental duration and the cycle time ( 60 s ) of each cycle . These data (dissolution rate versus potential) were fitted to calculate the expected dissolution rate for each test scenario. The dissolution rates in the RDE do not match those in the MEA due to differences in loading and interfacial contact, and do not account for potential inhomogeneities or gradients in the MEA catalytic layer.
After the durability test, cross-sections of the MEA samples were analyzed to analyze changes in the catalyst and catalyst layer structure. Ion beam ( FIB ) analysis was used to determine changes in the catalyst layer structure, including electrode porosity. XRD analysis was also performed to determine changes in catalyst particle size during the durability test. The catalyst layer was scraped off the MEA using a knife blade to obtain an XRD pattern of the catalyst after the durability test , and the average catalyst particle size and size distribution were determined.
Results and Discussion
MEAs were tested for durability using both constant potential and fluctuating inputs (triangle and square waves) . MEA component testing focused on catalyst layer degradation and degradation mechanisms due to steady-state and intermittent operation, while minimizing other degradation processes. Other component degradation, including single-cell components (including membranes) / porous transport layers ( PTLs ), and other degradation processes, including start-up / shutdown operations (pressure and hydrogen cross-permeation), contaminants, catalyst layer thickness (voltage gradient), and transport limitations ( PTL/ water transport), can all lead to voltage loss. Evaluating these loss sources is essential for predicting electrolysis equipment life. This study avoided these losses, exploring the impact of catalyst degradation, intermittent and dynamic fluctuations on catalyst durability, and using single-cell durability as a criterion for catalyst development.
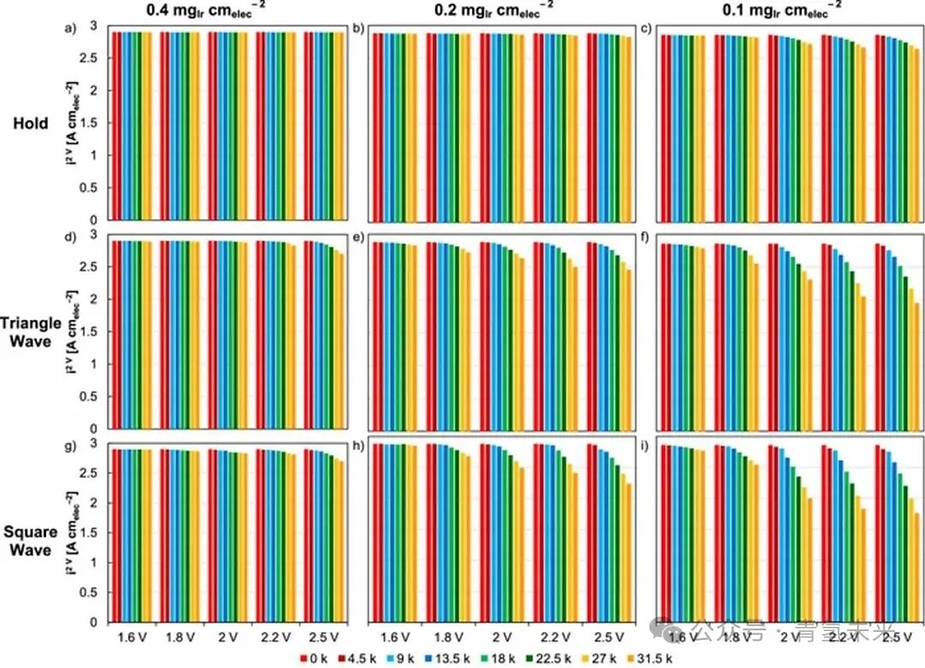
Figure 1. Constant potential test of MEAs with different iridium loadings ( 0.4 , 0.2 , and 0.1 mg/cm2 ) : (a ) 0.4 , ( b ) 0.2 , and ( c ) 0.1 mg/cm2 . Triangular wave test of MEAs with different iridium loadings : ( d ) 0.4 , ( e ) 0.2 , and ( f ) 0.1 mg/cm2 . Square wave test of MEAs with different iridium loadings : ( g ) 0.4 , ( h ) 0.2 , and ( i ) 0.1 mg/ cm2 . Performance data is presented as current density at 2 V , including initial values and values after 75 , 150 , 225 , 300 , 375 , 450 , and 525 h , corresponding to 4.5 , 9 , 13.5 , 18 , 22.5 , 27 , and 31.5 k cycles (triangle and square waves). Potential hold values were achieved at 1.6 , 1.8 , 2 , 2.2 , and 2.5 V. Triangle and square wave cycles were achieved at a lower potential of 1.45 V and at higher potentials of 1.6 , 1.8 , 2 , 2.2 , and 2.5 V.
By mitigating other degradation sources, this study primarily examined the impact of voltage (type, degree, and duration) on the catalyst. In addition to constant potential, triangular and square wave cycles were used to assess the impact of fluctuations (Figure 1 ). Significant performance degradation was observed at low catalyst loadings (< 0.4 mg/cm² ) and high voltages (> 1.8 V ) (Figure 2 ). At catalyst loadings ≥0.4 mg/cm² ( Figures 1a , 1d , and 1g ), increasing the potential from 1.6 to 2.5 V did not significantly reduce performance. While performance degradation is not solely dependent on catalyst loading, a thicker catalyst layer may have acted as a buffer, delaying the onset of performance loss. Lower catalyst loadings accelerated performance degradation, while thinner catalyst layers provided less effective shielding against iridium dissolution. At 2V , with a loading of 0.4mg/cm² , performance loss was 0% ( [email protected]/cm² , Figure 1a ). At loadings of 0.2 and 0.1mg/cm² , greater losses of 1% ( [email protected]/cm² , Figure 1b ) and 5% ( [email protected]/cm² , Figure 1c ), respectively, occurred . At 1.6V , no significant performance change occurred regardless of the test protocol. Performance loss increased when the MEA was tested at higher potentials (evaluated for each test protocol and loading) due to the increasing iridium dissolution rate with increasing potential. Although the high potential duration was shorter, intermittent input led to greater performance degradation. At 0.1mg /cm² , constant operation at 2V resulted in a 5% loss ( [email protected]/cm² , Figure 1c ). In the triangle wave and square wave tests, the loss rates were 19% ( 2 [email protected] A/ cm 2 , Figure 1f ) and 30% ( 2 [email protected] A/ cm 2 , Figure 1i ), respectively.
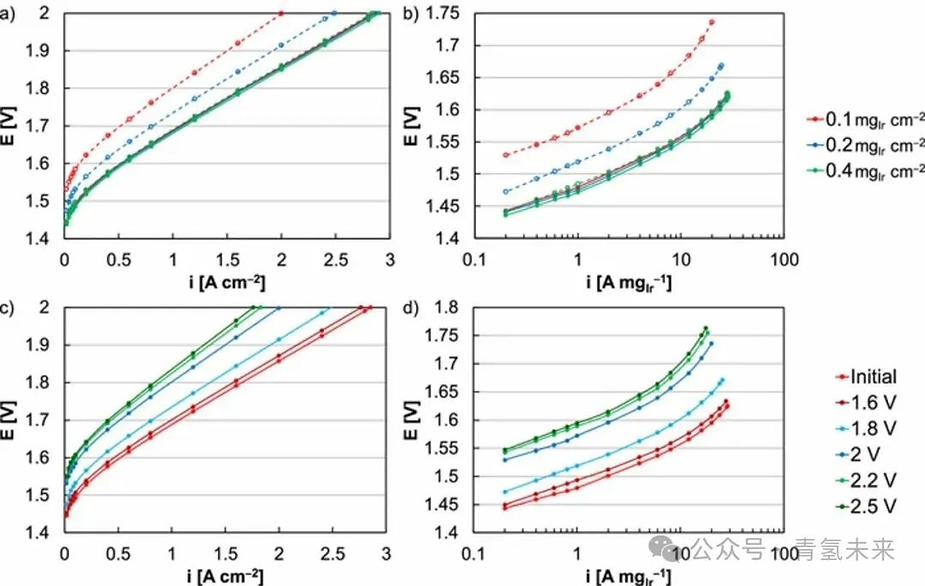
Figure 2. MEA initial polarization curves (solid line) and after 31.5 thousand square-wave cycles ( 525 h , 1.45-2 V ) at anode catalyst loadings of 0.1 (red), 0.2 (blue), and 0.4 mg/cm² ( green) . ( a ) Performance (uncorrected) and ( b ) kinetic performance ( HFR -corrected). Comparison of the initial MEA polarization curve (red) and after 31.5 thousand square-wave cycles (525 h ) at anode catalyst loadings of 0.1 mg/cm² and potential caps of 1.6 (dark red), 1.8 (blue), 2 (dark blue), 2.2 (green), and 2.5 (dark green) . ( c ) Performance (uncorrected) and ( d ) kinetic performance ( HFR -corrected).
In MEA testing, fluctuating performance decayed faster than at constant potential (Figures 1 and 3 ), with higher losses during fluctuating operation. Somewhat unexpectedly, cycling within the potential range ( >1.45V ) did not reveal iridium redox processes, iridium aggregation, or high dissolution rates of iridium metal. Potential cycling in MEAs may not produce an instantaneous or uniform potential in the catalytic layer, potentially accelerating dissolution due to excessively high local potentials. RDE studies found that square-wave cycling and faster frequencies increased iridium dissolution rates, attributing this to nonequilibrium processes in the catalyst layer. The operating principles of MEAs are similar to, but not identical to, RDE . The thickness of MEAs (membrane / catalytic layer) may accentuate this process compared to RDE .
in square wave testing ( 1.45-2V ) ( 20 -fold decrease in kinetics ) is more severe than the change across the catalyst layer ( 30% reduction in thickness ), potentially indicating uneven wear. The increased HFR at high potentials ( 1.45-2.5V square or triangle wave ) suggests damage to the catalyst layer and limited membrane / catalyst contact. The low catalyst loading and lack of support in MEA testing do not result in significant internal resistance drops or potential gradients within the catalyst layer.
Differences between adsorbing and non-adsorbing electrolytes may also explain the half-cell ( HClO₄ ) and single - cell observations (sulfonic acid ionomer). RDE tests in HClO₄ and H₂SO₄ electrolytes showed no differences in performance, durability, or dissolution rate of Ir oxide at relevant potentials . Square-wave tests exhibited greater losses than triangular-wave tests (Figure 1 ). The discrepancies in performance losses between the different test methods can be attributed to differences in Ir dissolution rates (Figures 3d-3f ). Ir oxide was held at a constant potential in the RDE for 120 h , with electrolyte samples periodically taken for ICP-MS analysis (Figure 3d ). The dissolution rate was calculated from the time-dependent evolution of iridium dissolution (Figure 3e ). These values cannot be directly correlated to iridium oxide dissolution rates in MEAs due to differences in catalyst loading, electrode area, and electrolyte / interface exposure , but relatively comparable iridium dissolution rates are expected (Figure 3f ). Iridium dissolution exhibited a nonlinear relationship with potential, with loading significantly affecting both iridium dissolution and durability, and was dependent on the potentiostatic time. The upper limit ( 2 V ) and average ( 1.725 V ) potentials for the triangle and square wave tests were identical, but the iridium oxide dissolution rate was higher during the square wave test, at 10.2 ng/cm² / h , compared to 7.1 ng/cm² / h for the triangle wave . This difference stems from the longer 2V (square wave) test duration, resulting in a higher iridium dissolution rate. This also accounts for the durability differences between these varying load modes.
Figure 3. ( a ) Potential profiles during MEA testing under constant, triangular wave, square wave, sawtooth rise, and sawtooth fall modes. ( b ) Comparison of MEA performance at 2 V under constant potential ( 525 h ), triangular wave ( 1.45–2 V , 525 h or 31,500 cycles), square wave ( 2 V–30 s , 1.45 V–30 s , 525 h or 31,500 cycles), sawtooth rise test ( 2 V–30 s , 2–1.45 V for 30 s , 525 h or 31,500 cycles ), and sawtooth fall test ( 2 V–30 s , 1.45–2 V for 30 s , 525 h or 31,500 cycles) . ( c ) Comparison of the initial MEA polarization curve (red) with the polarization curves after AST testing ( 525 h or 31,500 cycles) for 2 V (dark red), triangular wave curve ( 1.45–2 V , blue), square wave curve ( 2 V–30 s , 1.45 V–30 s , green), sawtooth rising curve ( 2 V–30 s , 2–1.45 V–30 s , yellow), and sawtooth falling curve ( 2 V–30 s , 1.45–2 V–30 s , gray). ( d ) Iridium dissolution measured by ICP-MS . ( e ) Iridium dissolution rate in RDE as a function of voltage. The dissolution rate was determined based on the linear fit (dashed line) in panel ( d ). ( f ) Upper limit potential, average potential, and approximate dissolution rate (expressed as RDE ) for holding modes such as constant potential, triangle wave, square wave, rising sawtooth wave, and falling sawtooth wave. The dissolution rate calculated based on the test curve is a fit (dashed line) from the potential in panel ( a ) and the approximate Ir dissolution rate in panel ( e ) .
In addition to differences in iridium dissolution rates, the ramp rate may also have accelerated the decay process. To assess this effect, sawtooth curves were used to evaluate the relative contributions of the potential ramp and the dwell time at the potential potential (Figure 3a ). Two sawtooth curves were used: the rising sawtooth represents a step change from 1.45 V to 2 V followed by a gradual decrease from 1.45 V , while the falling sawtooth represents a gradual increase from 1.45 V to 2 V followed by a step change to 1.45 V (Figure 3a ). For these tests, the average potential ( 1.863 V ) and iridium oxide dissolution rate ( 13.6 ng/cm² / h in the RDE test ) were identical. However, the performance loss caused by the sawtooth rising curve ( 32% at 2 V , from 2.85 A/ cm² to 1.93 A/cm² ) was higher than that caused by the sawtooth falling curve ( 25% at 2 V , from 2.85 A / cm² to 2.14 A/cm² ) , indicating that the load variation accelerated the loss of the catalytic layer (Figures 3b and 3c ). Comparing the sawtooth rising wave with the square wave, both waveforms result in a sudden increase in potential (from 1.45 V to 2 V ). The sawtooth rising wave resulted in similar but slightly higher losses than the square wave ( 32% and 30% at 2 V , respectively , Figures 3b and 3c ). Comparing the sawtooth falling wave ( 25% loss at 2 V ) with the triangle wave ( 19% loss at 2 V ), both waveforms produce a gradual potential increase (Figures 3b and 3c ). A sawtooth waveform accelerates durability loss, exposing the catalyst layer to higher potentials and leading to increased iridium dissolution (Figure 3f ). The ramp rate can also accelerate degradation and impact the lifespan of PEM electrolyzers. It was found that slowing the rate of potential increase gradually bridged the loss difference between a square wave ( 30% loss at 2V ) and a triangular wave ( 19% loss at 2V ). While reducing the ramp rate can mitigate losses associated with sudden potential increases, intermittency (load cycling) and applied potential (dissolution rate) have a greater impact on MEA durability. Using potential as a system control strategy may be more effective during intermittent operation.
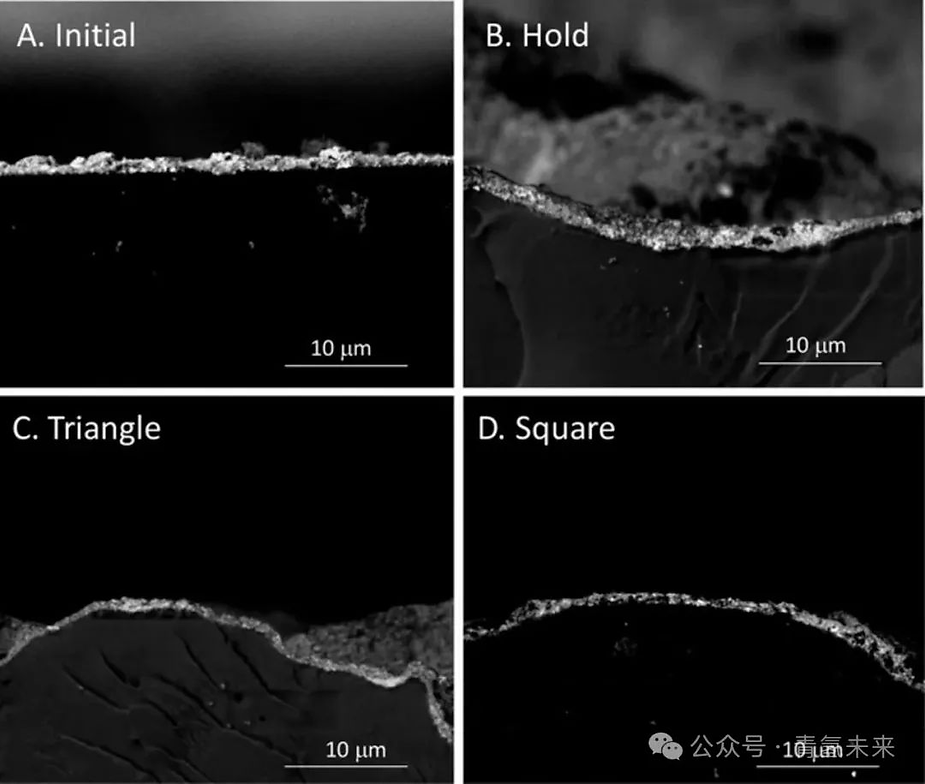
Figure 4. SEM images of the MEA cross section after durability testing , highlighting the catalytic layer using backscattered electrons, ( a ) initial state, ( b ) long-term operation ( 525 h , 31.5 thousand cycles), ( c ) constant voltage ( 2 V ), ( d ) triangle wave ( 1.45-2 V ), ( e ) square wave ( 2 V-30 s , 1.45 V-30 s ).
Table I. Comparison of anode catalyst layer thickness, porosity, pore area, and pore size (square wave, 2 V-30 s , 1.45 V-30 s ) in the initial state and after endurance operation ( 525 h , 31.5k cycles) .
Test parameters Initial ( 0 turns) Square wave ( 31.5k cycles)
Catalytic layer thickness ( μm ) 1.07 0.77
Average porosity of IrO2 catalytic layer ( % ) 38.8 33
IrO2 catalytic layer ( μm 2 ) 0.004 0.002
Average pore size of IrO2 catalytic layer ( nm ) 52.9 35.9
The effects of long-term operation on electrolyzer components were evaluated through characterization of post-test samples and single-cell performance. Square wave tests ( 2V-30s , 1.45V-30s ) were performed at an Ir loading of 0.1 mg/cm² . MEA cross-sectional tests revealed thinning of the catalytic layer with prolonged operation, with potential cycling exacerbating this thinning (Figure 4 ). After the square wave test, the porosity of the Ir catalyst layer decreased slightly ( from 38.8% to 33% ), and the finite pore size decreased significantly (from 52.9nm to 35.9nm ). XRD analysis of the iridium oxide catalyst before and after the MEA test revealed changes in the Ir crystal structure, from a face-centered cubic structure with a symmetrical unit cell (initial state) to a body-centered tetragonal structure (after the test). Square wave test results indicate that the concentration of metallic Ir increased, and the square wave test process led to more significant crystallographic changes in the Ir catalyst structure. During the impedance measurement, the low-frequency resistance ( Rp,α ) increased and the capacitance ( Cα ) decreased, likely due to corrosion of the catalyst layer and losses at the catalyst / ionomer / membrane interface (Figures 5c and 5d ). Other degradation factors, including membrane thinning and PTL passivation or corrosion, may also be present, but their impact is relatively minor because the HFR remains constant (membrane / contact resistance, Figures 5c and 5d ) and the PTL is repeated .
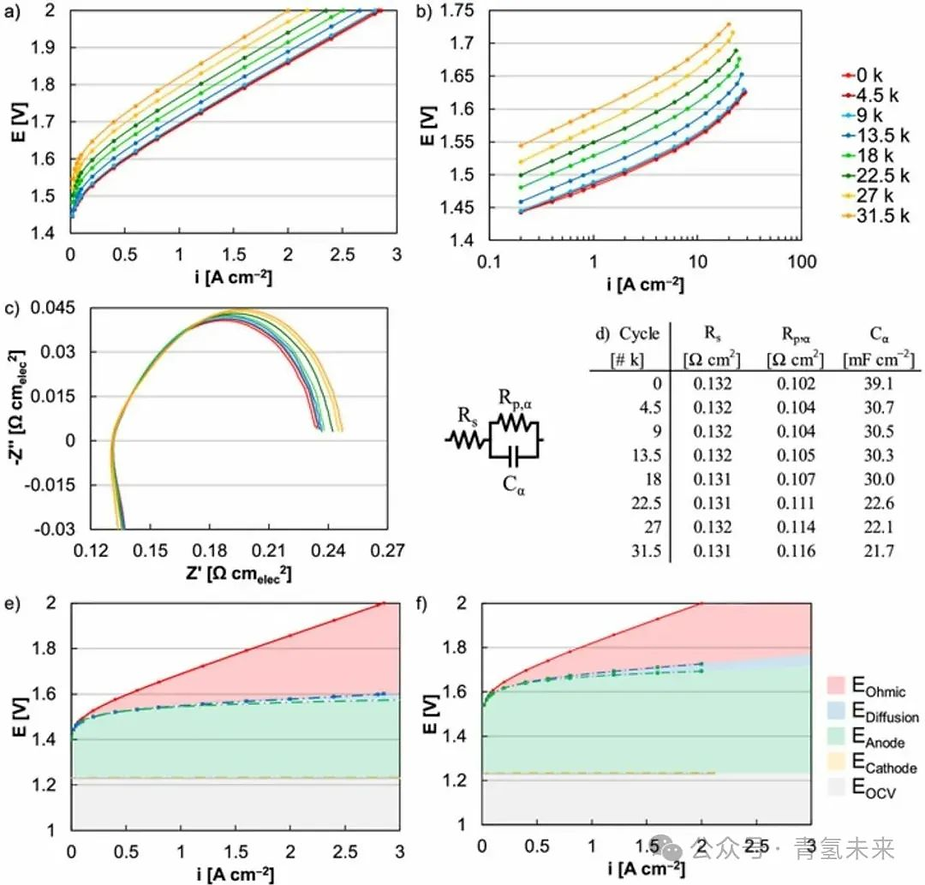
Figure 5. Polarization curves (square wave, 1.45-2 V ) after MEA durability testing with an iridium loading of 0.1 mg/cm² . ( a ) Overall performance (uncorrected) and ( b ) kinetic performance ( HFR corrected). ( c-d ) MEA durability impedance data (square wave, 1.45-2 V ) at 0.2 A/cm² . MEA performance at ( e ) initial stage ( 0 k ) and ( f ) after 31.5 k cycles (square wave, 1.45-2 V ).
Polarization curves (Figure 5a ) were used to evaluate the relative changes in kinetics, mass transfer, and ohmic resistance during MEA durability at an iridium loading of 0.1 mg/cm² using a square wave test ( 2 V for 30 s and 1.45 V for 30 s ). Ohmic losses (Figures 5e and 5f) were determined by the difference between the HFR -corrected and uncorrected polarization curves. Mass transfer losses (Figures 5e and 5f ) were determined by the difference between the kinetic performance ( Tafel slope) and the HFR -corrected polarization curves. Kinetic losses ( Eanode , Ecathode , Figures 5e and 5f ) were determined by correcting the HFR and mass transfer ( Tafel slope) from Tafel plots (Figure 5b ), where the relative values of the kinetics at the anode and cathode were approximated by the RDE exchange current density for Ir ( OER , 1.7×10⁻⁶ A /mg Ir ) and the MEA exchange current density for Pt (hydrogen peak, 535 A/mg Pt ). Comparing the performance of the MEA at the beginning of its life and after 31.5 thousand cycles revealed significant losses, ranging from 30% at 2 V ( from 2.86 A/ cm² to 2.00 A/cm² ) to a 20 -fold reduction in kinetics ( from 0.8 to 0.04 A/ cm² at 1.532 V , Figures 5a and 5b ). The overpotential increased by 142 mV at 2 A/cm² and by 101 mV at 0.02 A/cm² ( Figures 5a and 5b ). First, ohmic and mass transfer losses increased slightly, but these did not change significantly after extended operation because the testing protocol focused primarily on catalyst durability, not the membrane (no pressure was applied) or other components (coated PTL , flow field). The slight increase in ohmic and mass transfer losses may be due to changes in the catalytic layer, leading to degradation of the catalyst / ionomer / membrane interface. Second, kinetic losses were the primary cause of performance degradation over extended operation (Figures 5b , 5e , and 5f ). The Tafel plot shows significant variations in the exchange current density (Figure 5b ), indicating kinetic losses. The significant increase in kinetic losses and slight changes in ohmic and mass transfer losses were similar across all MEAs tested (regardless of potential or testing protocol).
In addition to evaluating the impact of the AST test on MEA durability, the cycle period was shortened and extended to investigate how cycling affects performance. The effect of frequency on performance varies over time (Figure 6a ). The anode iridium loading was 0.1 mg/cm2 , and the test was performed at a 1.45-2V square wave. Increasing the cycle frequency leads to accelerated durability loss, but the frequency and performance loss do not change in direct proportion (Figures 6b and 6c ). Durability loss is mainly dominated by kinetic degradation. The mechanism of kinetic loss (iridium dissolution) and its manifestation in the MEA (thinning of the CV curve and increased polarization resistance) do not appear to have changed, but increasing the cycle frequency significantly accelerates the degradation process and leads to higher performance loss.
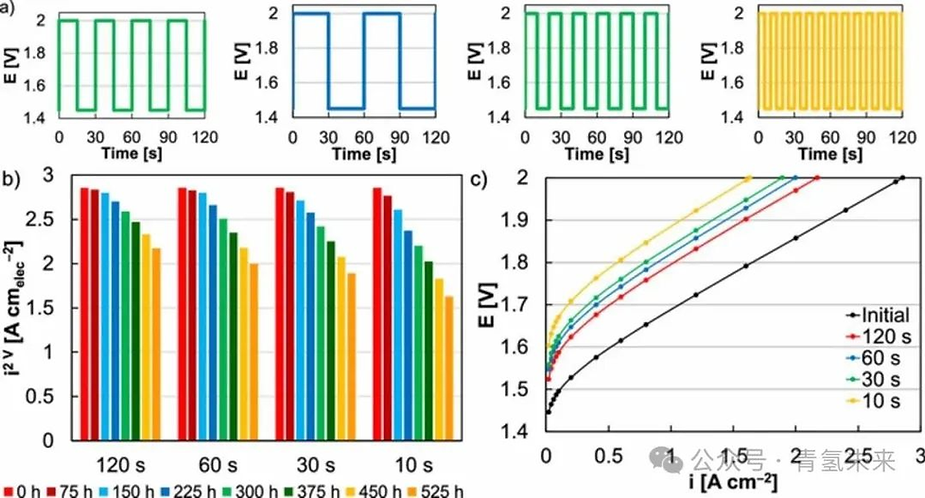
Figure 6. ( a ) Load curves with different square wave cycling frequencies, including 120 s , 60 s , 30 s, and 10 s per cycle . ( b ) Comparison of MEA performance ( @2 V ) treated at different cycling frequencies . ( c ) Comparison of initial MEA polarization curves (black) and after 525 h of operation , with cycling frequencies varied to include cycles of 120 s (red), 60 s (blue), 30 s (green), and 10 s (yellow).
a PEM electrolyzer coupled with fluctuating renewable energy (wind and solar) inputs was conducted to assess whether square and triangular wave modes are associated with accelerated losses along the renewable energy load curve. The renewable energy input was converted to potential values for comparison with previous test results (Figure 1 ), with the maximum ( 2.25 V ), minimum ( 1.45 V ), and average ( 1.70 V ) potential values held constant (Figures 7a and 7b ). After 90 days, the wind-based input resulted in a 13% performance loss at 2 V , representing a 62 mV increase in overpotential at 2 A/cm² and a 45 mV increase at 0.02 A/cm² (Figures 7c and 7d ). The solar-based input showed similar losses, at 12% at 2 V , representing a 54 mV increase in overpotential at 2 A/cm² and a 36 mV increase at 0.02 A/cm² (Figures 7c and 7f ). The performance degradation was significantly less than that observed with triangle and square wave tests using the same potential ( 1.45-2.2V ) and catalyst loading ( 0.1mg/cm² ) ( 36% and 28% drops, respectively ). The performance loss due to renewable energy occurred over a longer period ( 3 months vs. 3 weeks). Compared to the fluctuating test cycle, switching between a constant load ( 1.45V ) and full load ( 2.25V ) occurred only once a day, rather than every minute , and the cycling frequency was also changed. The performance degradation became more pronounced as the test duration increased.
https://static.wixstatic.com/media/b22ffa_5614180070db49f1a3550401605aeccb~mv2.png/v1/fill/w_925,h_498,al_c,q_90,usm_0.66_1.00_0.01,enc_avif,quality_auto/b22ffa_5614180070db49f1a3550401605aeccb~mv2.png
https://static.wixstatic.com/media/b22ffa_ba7c6278fa9d4ba69723241d1d8523c1~mv2.png/v1/fill/w_925,h_1253,al_c,q_90,usm_0.66_1.00_0.01,enc_avif,quality_auto/b22ffa_ba7c6278fa9d4ba69723241d1d8523c1~mv2.png
Figure 7. ( a ) Modeled wind energy curve acquired from the M2 tower ( 50 m above sea level) at the National Wind Energy Technology Center on January 30, 2018 , combined with the corresponding potential applied during extended MEA operation. ( b ) Modeled solar energy curve acquired from PVDAQ Site 51 at the National Renewable Energy Laboratory on April 1, 2018 , combined with the corresponding potential applied during extended MEA operation. The potential was calculated to maintain the same range ( 1.45–2.25 V ) and average value ( 1.70 V ). ( c ) MEA performance at 2 V compared to wind (blue) and solar (green) energy curves. MEA polarization curves and Tafel plots ( d–e ) and wind energy input curves ( f–g ) during endurance operation .
Comparing wind and solar inputs, the wind input exhibits slightly greater losses, likely due to a slightly higher iridium dissolution rate ( 150 ng/cm² / day for wind and 131 ng/cm² / day for solar in the RDE ). Furthermore, the voltage exhibits multiple sudden spikes (at 6:30 and 20:00 , Figure 7a ). Renewable energy input enhances MEA durability compared to conventional or frequently cycled MEAs, but analysis of the polarization curves reveals the same loss mechanisms (Figures 7e and 7g ). As with the triangle and square wave tests, losses are primarily driven by kinetics, while ohmic and mass transfer losses vary slightly (Figures 7e and 7g ). High-frequency resistance (ohmic losses) remains relatively constant, while polarization resistance increases and capacitance decreases. As with the AST test, performance losses due to renewable energy input are likely caused more info by iridium dissolution, leading to thinning of the catalyst layer and degradation of the catalyst / ion / membrane interface. From this perspective, testing MEAs with intermittent input accelerates losses due to intermittent input and can be used to predict their impact on device lifespan.
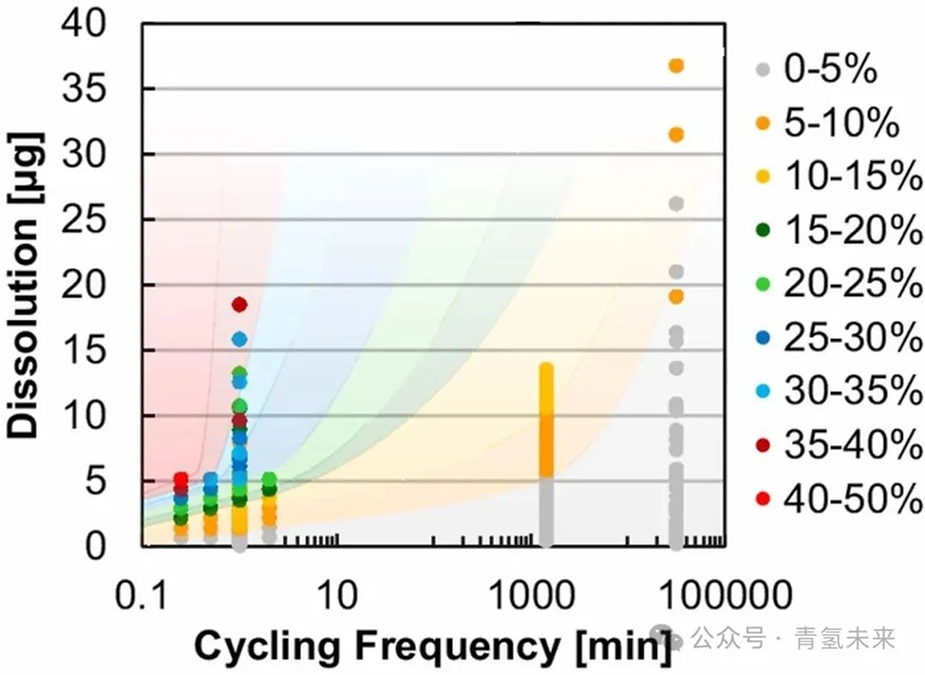
Figure 8. MEA performance loss (expressed as a percentage) at 2 V versus cycle frequency ( x - axis ) and iridium dissolution rate (measured by RDE ).
MEAs with an iridium loading of 0.1 mg/cm² for various test factors, including AST type (constant voltage, triangle wave, square wave), AST acceleration level (peak potential), experimental duration ( 0-525 h , 0-31.5 thousand cycles) , cycling frequency, potential ramp (sawtooth, gentle square wave), and regenerative input . Performance degradation is plotted as a function of the number of cycles ( x -axis) and the expected dissolution rate ( derived from RDE , y -axis). Even at lower catalyst loadings, a combination of high acceleration (higher iridium dissolution rate) and intermittent operation is required to cause MEA performance degradation within a relatively short period of time. High cycling frequency is necessary, as even at relatively high potentials, maintaining a constant potential results in minimal MEA performance degradation. Conversely, high AST acceleration conditions are required to increase the iridium dissolution rate and lead to MEA performance degradation. Generally, electrolytic losses increase with increasing iridium dissolution rate and cycling frequency. Occasionally, deviations from these trends occur due to differences in ramp rates (square and triangle); however, these differences are often minor. High potentials are required to observe significant performance degradation over shorter time periods, and moderate current density intensities may not be sufficient to reasonably predict service life. Intermittent, fluctuating energy coupling can lead to significant durability losses, which may impact low-temperature operation strategies and cost projections for PEM electrolyzers.
in conclusion
This study focused on catalyst degradation under low catalyst loading and intermittent operating conditions in PEM hydrogen production, based on MEA durability. Iridium dissolution is independent of catalyst loading, but a thick catalyst layer can provide a buffer for iridium dissolution, delaying and masking performance degradation. At low catalyst loading and high potential, significant durability loss was observed in a relatively short period of time ( 525h-AST test). Although a specific potential range was used to avoid iridium redox, fluctuating operation resulted in greater performance loss, and frequent cycling accelerated degradation. Fluctuating test variables included AST type (constant potential, triangle wave, square wave), acceleration intensity (peak potential), cycling frequency, and potential ramp (sawtooth wave, slow square wave), resulting in varying degrees of kinetic performance loss.
( 1 ) The decline in kinetic performance is related to the thinning of the catalyst layer and the increase in polarization resistance. Iridium dissolution and degradation of the catalyst layer interface are the main reasons for the loss of durability. Higher fluctuation frequency and high potential will lead to accelerated performance degradation; sudden changes in potential will also slightly increase the degradation rate. The performance degradation mechanism caused by triangle wave and square wave tests is similar to that of simulating renewable power input; higher cycle frequency will accelerate performance loss and may be used to predict the impact of intermittent operation on the service life of PEM water electrolysis equipment.
( 2 ) Currently, PEM electrolyzers have a certain degree of durability, but in order to reduce the cost of hydrogen production, PEM electrolysis technology will develop towards lower catalyst loading and renewable energy coupling. Low catalyst loading and fluctuating operation will significantly accelerate performance loss, and electrolyzer performance loss needs to be evaluated and reduced. The thin catalytic layer and high potential at low catalyst loading are key factors leading to performance loss, which indicates that short-term testing at medium catalyst iridium loading and current density may not be sufficient to evaluate long-term durability.
( 3 ) Durability loss will affect the ability of PEM electrolyzers to operate at low catalyst loadings and coupled with renewable energy fluctuations. It is necessary to start from both component development and system control to reduce the electrolysis voltage and performance degradation.
References
[1] Alia SM , Stariha S , Borup RL .Electrolyzer Durability at Low Catalyst Loading and with Dynamic Operation[J].Journal of The Electrochemical Society, 2019, 166(15):F1164-F1172.DOI:10.1149/2.0231915jes.